Figure 2.

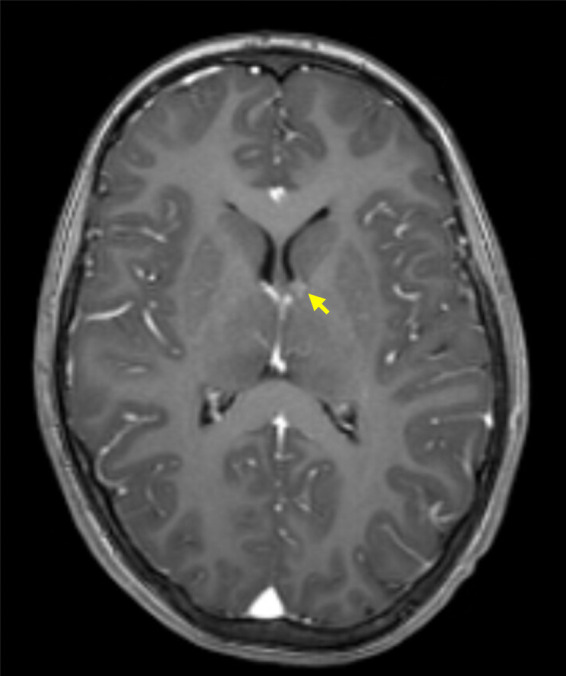
Small SEGA of the left hemisphere, in a child diagnosed with TSC. The image represents a T1-weighted MRI axial section after intravenous gadolinium administration (arrow points to SEGA).

Small SEGA of the left hemisphere, in a child diagnosed with TSC. The image represents a T1-weighted MRI axial section after intravenous gadolinium administration (arrow points to SEGA).