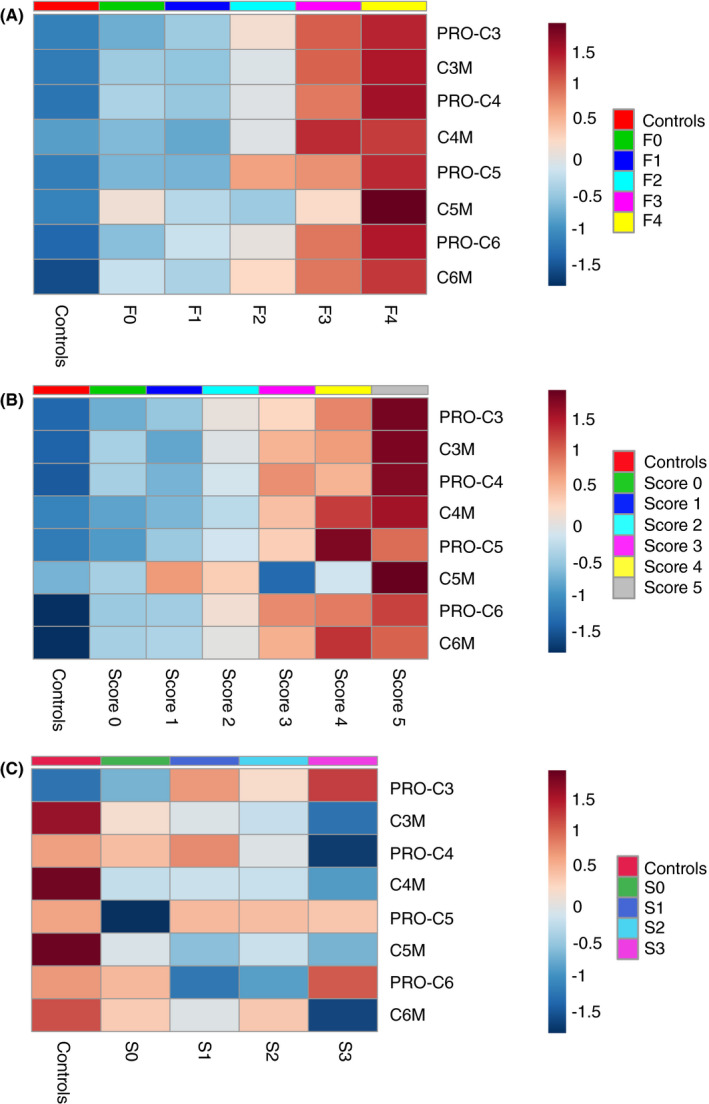
FIGURE 2.

Heatmaps illustrating the concentration of the eight biomarkers according to (A) histological fibrosis stage, (B) hepatic inflammatory activity grade and (C) steatosis score with the 50 healthy, matched controls as comparator. The heatmaps visualise changes in normalised collagen concentrations along (A) fibrosis stages, (B) the sum of ballooning and lobular inflammation and (C) steatosis score. Blue illustrates that the average, normalised concentration in a group is below the overall average for all 281 alcohol‐related liver disease (ALD) and 50 controls, whereas red denotes a positive distance to the overall average. The figures show a positive correlation between all eight collagen markers and increasing fibrosis stages, and a similar positive correlation with hepatic inflammatory activity. The positive correlations are most evident for fibrosis stages F3‐4, and for the most severe inflammation sums 4‐5. Type V collagen degradation (C5M) exhibited a less clear pattern than the other collagen markers. For steatosis, type III collagen formation marker (PRO‐C3) was the only collagen marker that significantly increased in ALD patients when steatosis scores rose. The heatmaps are generated using the Metaboanalyst web‐based R packages with Pearson coefficients as distance measure and average (median) as clustering algorithm, after normalisation of data with log transformation and Pareto scaling
