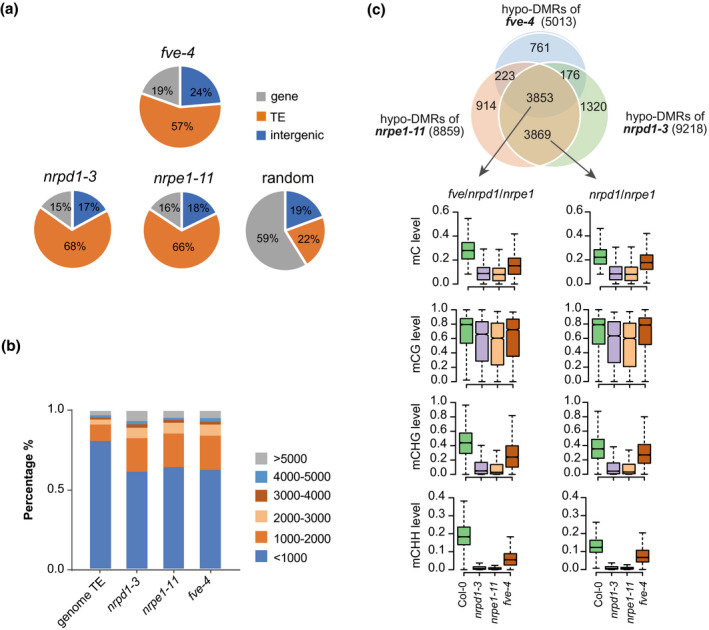
Figure 1.

Effects of FVE on DNA methylation levels at the RdDM target loci.
(a) Pie charts showing the distribution of hypo‐DMRs in fve‐4, nrpd1‐3, nrpe1‐11, and random selected regions in wild type.
(b) Length distributions of TEs in the genome and in different groups of hypo‐DMR regions in nrpd1‐3, nrpe1‐11, and fve‐4.
(c) Venn diagrams showing the overlap among hypo‐DMRs in nrpd1‐3, nrpe1‐11, and fve‐4 versus Col‐0. The fve/nrpd1/nrpe1 hypo‐DMRs refer to 3853 overlapping DMRs in fve‐4, nrpd1‐3, and nrpe1‐11. The nrpd1/nrpe1 hypo‐DMRs refer to 3869 DMRs that only overlapped between nrpd1‐3 and nrpe1‐11. The numbers of hypo‐DMRs for each mutant are shown in parentheses. The box plots show mC, mCG, mCHG, and mCHH (where H represents A, C, or T) levels of different subgroups of hypo‐DMRs in Col‐0, nrpd1‐3, nrpe1‐11, and fve‐4.
