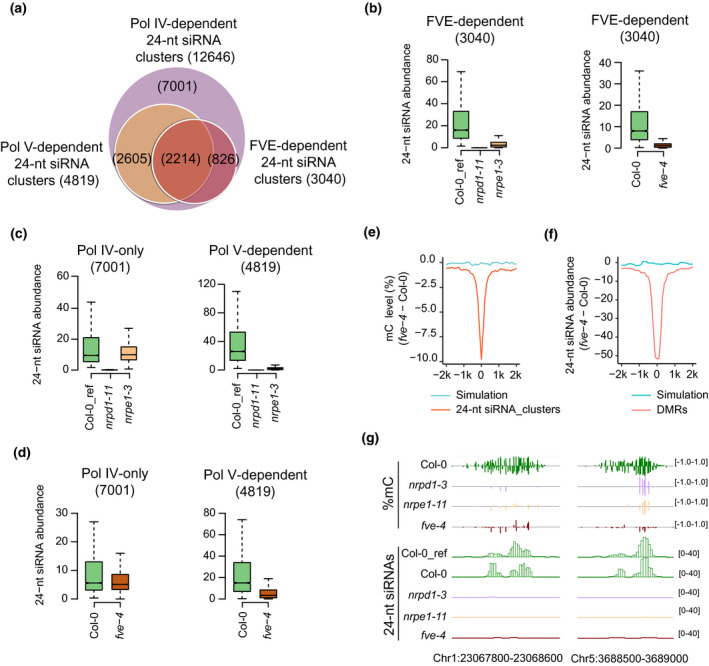
Figure 2.

Effects of FVE on 24‐nt siRNA accumulation.
(a) Venn diagrams showing the overlap among FVE‐, Pol IV‐, and Pol V‐dependent 24‐nt siRNA clusters. The numbers of 24‐nt siRNA are shown in parentheses.
(b) Box plots showing abundance of FVE‐dependent 24‐nt siRNAs in Col‐0 wild type and nrpd1‐3, nrpe1‐11, and fve‐4 mutants. Statistical analysis was performed using Wilcoxon tests. A list of P‐values is provided in Table S4.
(c) Box plots showing abundance of 24‐nt siRNAs in Col‐0 wild type and nrpd1‐3 and nrpe1‐11 mutants in the Pol IV‐only (left) and Pol V‐dependent (right) 24‐nt siRNA cluster regions. Statistical analysis was performed using Wilcoxon tests. A list of P‐values is provided in Table S4.
(d) Box plots showing abundance of 24‐nt siRNAs in Col‐0 wild type and fve‐4 in the Pol IV‐only (left) and Pol V‐dependent (right) 24‐nt siRNA cluster regions. Statistical analysis was performed using Wilcoxon tests. A list of P‐values is provided in Table S4.
(e) Changes of DNA methylation levels in fve‐4 relative to Col‐0 wild type at FVE‐dependent 24‐nt siRNA cluster regions.
(f) Changes of 24‐nt siRNA levels in fve‐4 relative to Col‐0 wild type at fve‐4 hypo‐DMRs.
(g) Genome browser views of DNA methylation levels and 24‐nt siRNA accumulation in Col‐0, fve‐4, nrpd1‐3, and nrpe1‐11 at selected RdDM loci.
