
Figure 3.
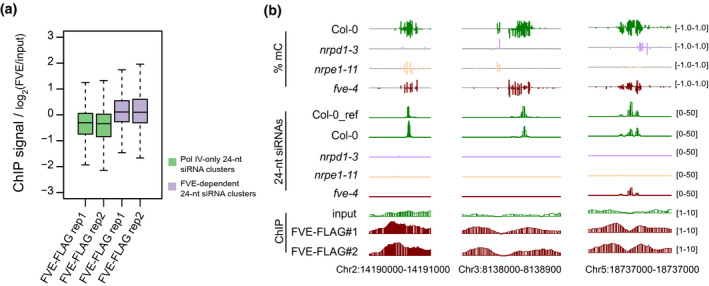
Enrichment of FVE at 24‐nt siRNA target loci.
(a) Box plots showing the enrichment signals of FVE at FVE‐dependent 24‐nt siRNA cluster regions and Pol IV‐only 24‐nt siRNA cluster regions. Two independent biological replicates of FVE‐3xFLAG ChIP‐seq data are shown.
(b) Genome browser views of DNA methylation levels, 24‐nt siRNA accumulation, and ChIP signals of FVE‐3xFLAG at selected loci in the genome. Two replicates of FVE‐3xFLAG are displayed.