FIGURE 3.

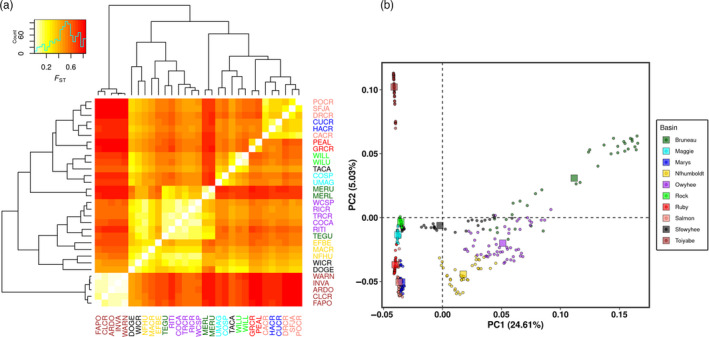
Population structure based on a F ST matrix (a) and a principal component analysis (b) in Rana luteiventris. (a) Pairwise F ST were calculated for each pair of breeding sites and were all significant (p‐values are provided in Table S12). Breeding sites (Table S2) have been ordered based on a UPGMA cluster algorithm. (b) Principal component analysis represents the genetic variation within our SNP dataset. We coloured the individuals according to their hydrographic basin of origin [Colour figure can be viewed at wileyonlinelibrary.com]
