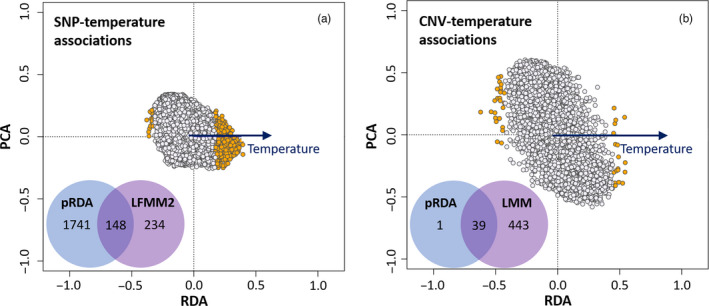
FIGURE 4.

Single nucleotide polymorphism (SNP)‐temperature (a) and copy number variant (CNV)‐temperature (b) associations using partial redundancy analyses (pRDA) in Rana luteiventris. We also provide Venn diagrams showing the number of candidate SNPs and CNVs detected using either RDA, or latent factor mixed models (LFMM2) or both methods combined [Colour figure can be viewed at wileyonlinelibrary.com]
