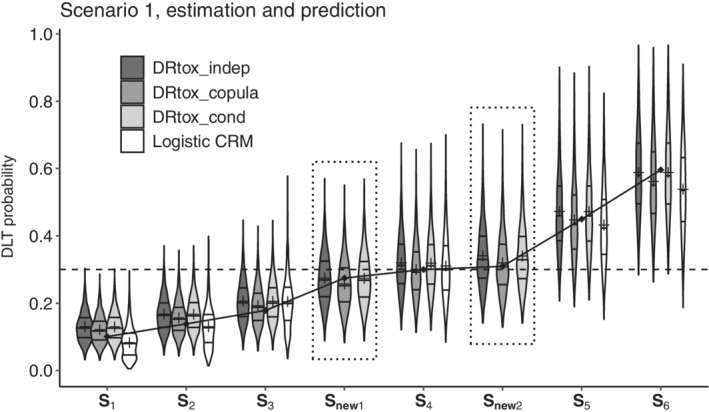
FIGURE 3.

Violin plots of the estimated probabilities of dose limiting toxicity (DLT) in Scenario 1 for the six dose regimens of the panel and two additional dose regimens ( and ), on 1000 trials with the three proposed joint approaches and the continual reassessment method (CRM). The predicted DLT probabilities of the new dose regimens are framed in dotted line. Horizontal lines on the density estimates represent the median and first and third quantiles of the distributions, and the plus sign represents the mean. The dashed line represents the toxicity target, and the solid line represents the true DLT probabilities
