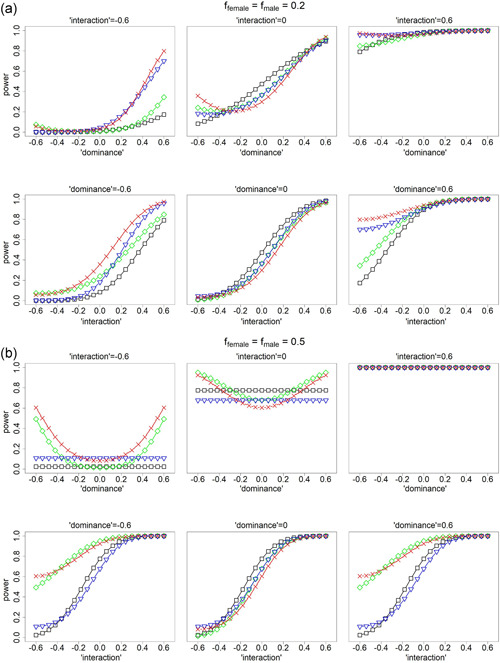
Figure 2.

Power comparison for analyzing X‐chromosomal single nucleotide polymorphisms (SNPs). Black curves for testing based on model as specified in Table 3, green curves for testing based on model , blue curves for testing based on model , and red curves for testing based on the proposed model . (a) ffemale = fmale = 0.2 and (b) ffemale = fmale = 0.5. Upper panels in (a) and (b) examine power as a function of the “dominance” effect. Lower panels in (a) and (b) examine power as a function of the gene–sex “interaction” effect. Note that biological dominance effect and skewed X‐chromosome inactivation (XCI), and gene–sex interaction effect and the XCI status are statistically confounded with each other; see Section 3.2. Results for other parameter values including differential between males and females are shown in Figures S5. The analyses related to – assume that the true baseline allele is known and being the allele frequency of the non‐baseline allele, and the true XCI status is known at the population level. Unlike the other methods (–), the proposed method () is invariant to the assumptions of the baseline allele and the XCI status
