
FIGURE 1.
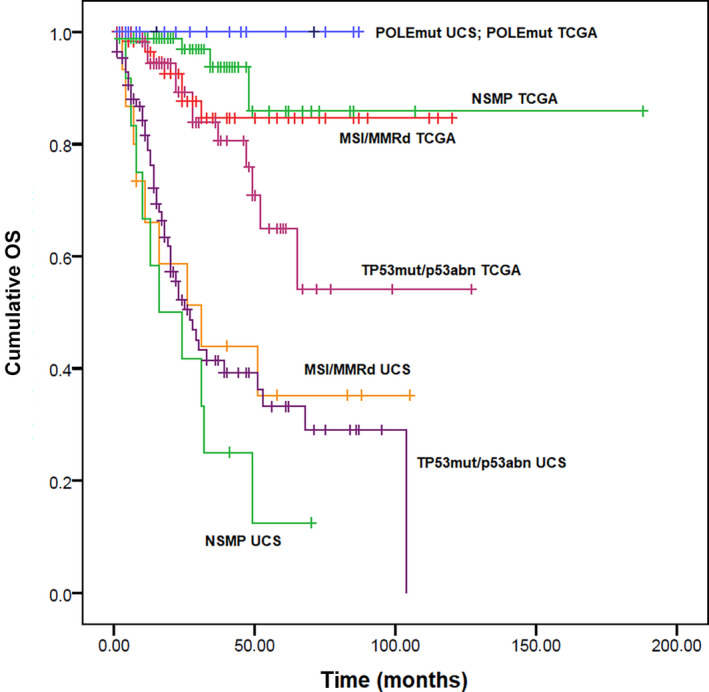
Kaplan–Meier curves for progression‐free survival in uterine carcinosarcoma and in the 2013 TCGA cohort, stratified based on the four TCGA molecular prognostic groups [Colour figure can be viewed at wileyonlinelibrary.com]
Official websites use .gov
A
.gov website belongs to an official
government organization in the United States.
Secure .gov websites use HTTPS
A lock (
) or https:// means you've safely
connected to the .gov website. Share sensitive
information only on official, secure websites.
Kaplan–Meier curves for progression‐free survival in uterine carcinosarcoma and in the 2013 TCGA cohort, stratified based on the four TCGA molecular prognostic groups [Colour figure can be viewed at wileyonlinelibrary.com]