FIGURE 2.

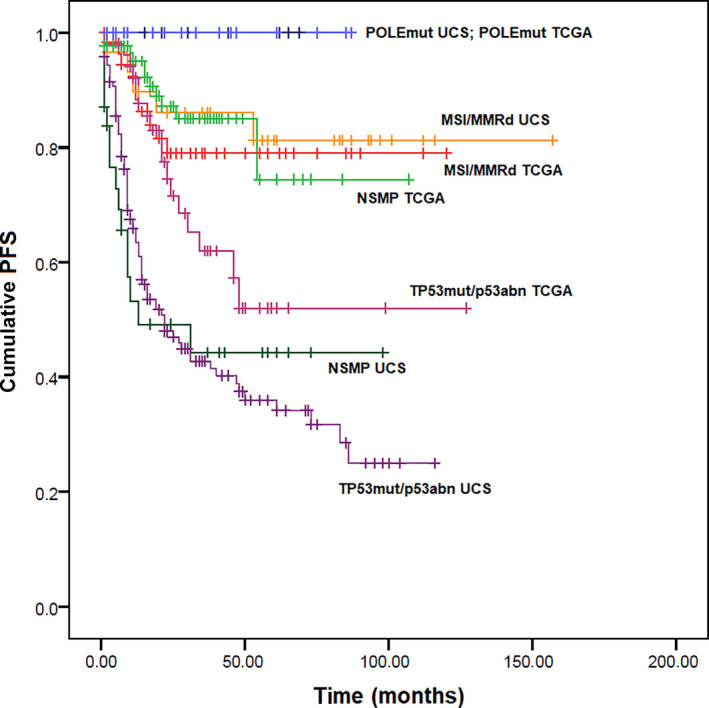
Kaplan–Meier curves for overall survival in uterine carcinosarcoma and in the 2013 TCGA cohort, stratified based on the four TCGA molecular prognostic groups [Colour figure can be viewed at wileyonlinelibrary.com]

Kaplan–Meier curves for overall survival in uterine carcinosarcoma and in the 2013 TCGA cohort, stratified based on the four TCGA molecular prognostic groups [Colour figure can be viewed at wileyonlinelibrary.com]