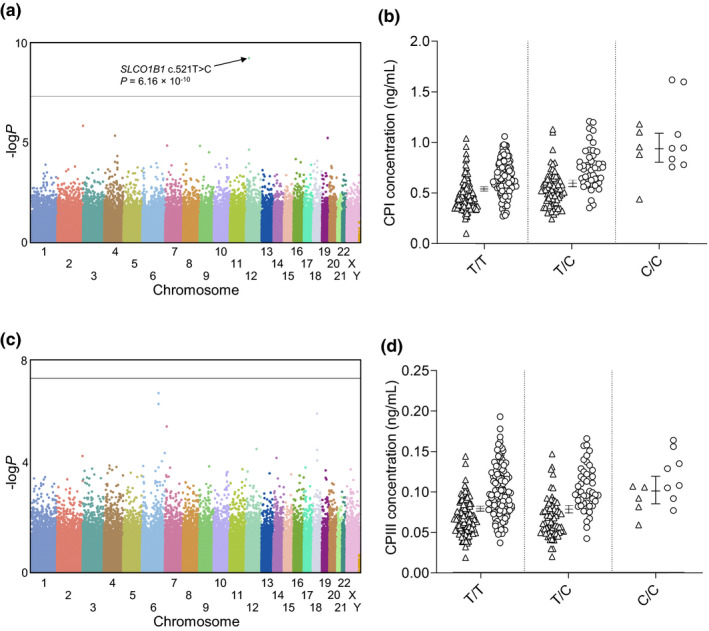
Figure 1.

Manhattan plots of the fasting plasma (a) CPI and (c) CPIII and the respective effects of SLCO1B1 c.521T>C on plasma (b) CPI and (d) CPIII levels. Horizontal line in a and c represents the genome‐wide significance level of 5 × 10⁻⁸. Horizontal lines in b and d indicate geometric marginal mean values and whiskers indicate 95% confidence intervals. Triangles, women; circles, men (b and d). CP, coproporphyrin.
