
FIGURE 2.
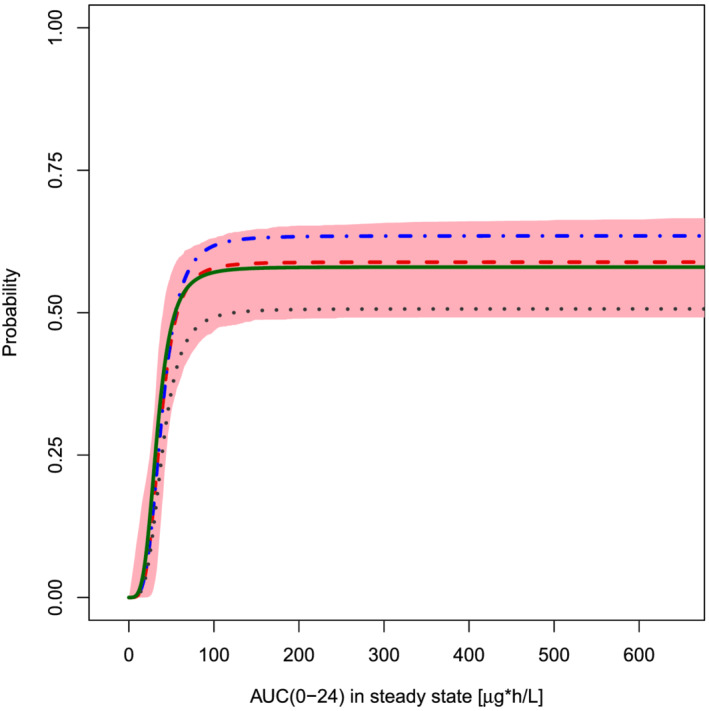
Predicted probability of induced amenorrhoea (no bleeding event) vs AUC(0–24)ss in all racial subgroups in ASTEROID 1. Red area: 95% CI of the predicted probability of non‐bleeding; predicted probability of non‐bleeding for all categories combined (red dashed line, n = 275), for Black or African Americans (black dotted line, n = 59), for Caucasian, Hispanic and other/not specified (blue dotted/dashed line, n = 146), and for Asian (green solid line, n = 70)