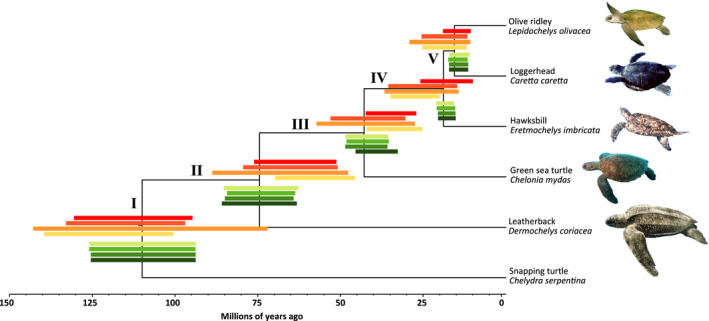
FIGURE 2.

Phylogenomic relationships between sea turtle species. Bars in each node represent the divergence estimates for mitogenomes (red shades, different bars correspond to different prior distributions) and nuclear exons (green shades, different bars correspond to different prior distributions) and follow the same order as Table 1
