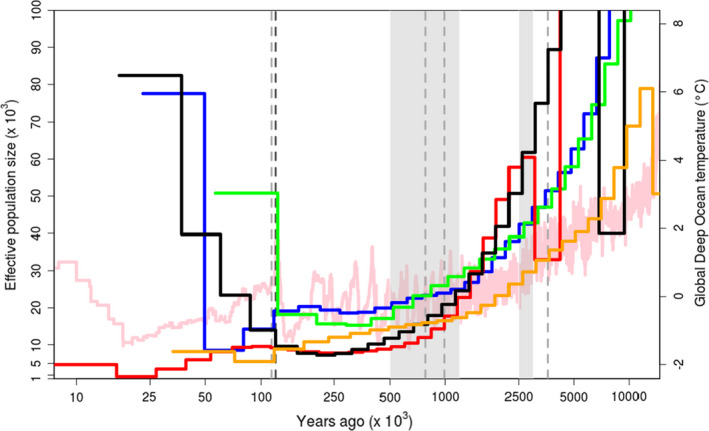
FIGURE 3.

MSMC effective population size estimates with two haplotypes per species. The mid‐Pleistocene transition (MPT, 0.5–1.2 million years ago, Ma) and the Plio‐Pleistocene transition (PPT, 3.0–2.5 Ma) are shown as the light grey shaded region, major geomagnetic polarity reversals are shown as light grey dotted lines (Gilbert‐Gauss: 3.6 Ma, Brunhes–Matuyama: 0.78 Ma, Blake: 0.114 Ma; (Valet & Meynadier, 1993), and the onset of the last glaciation (0.12 Ma ago) is shown as the dark grey dotted line. The light pink line shows the global deep ocean temperatures according to (Zachos et al., 2008). Bootstrap replicates can be found in Figure S2. Red, olive ridleys; Blue, hawksbills; Orange, loggerheads; Black, leatherbacks; Green, green turtles
