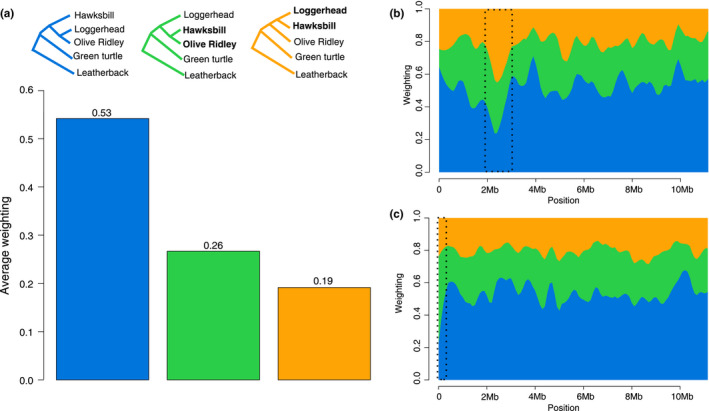
FIGURE 4.

Topology weighting averages across the genomes of four sea turtle species. (a) Only the three best tree topologies are shown. Discordant species relationships are shown in bold. Distribution of topology weightings smoothed as a locally weighted average (loess span = 1 Mb) showing two regions of discordant phylogenies in the first 10 Mb of (b) scaffold 10 and (c) scaffold 3
