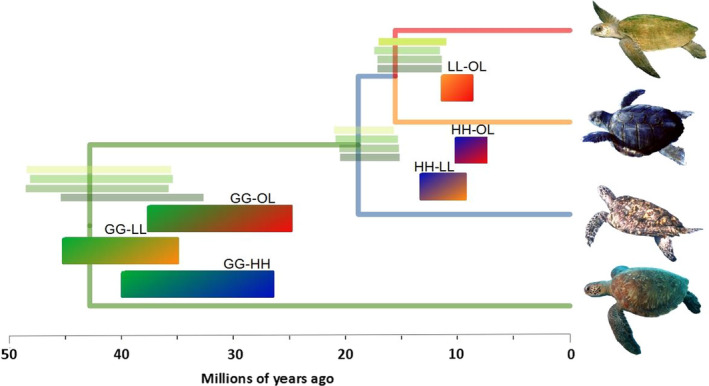
FIGURE 5.

Inference of the end of gene flow between four Cheloniidae species using hPSMC (solid‐coloured bars) compared to divergence estimates based on nuclear data from the phylogeny (green shaded bars in each node). GG, green turtles; HH, hawksbills; LL, loggerheads; OL, olive ridleys
