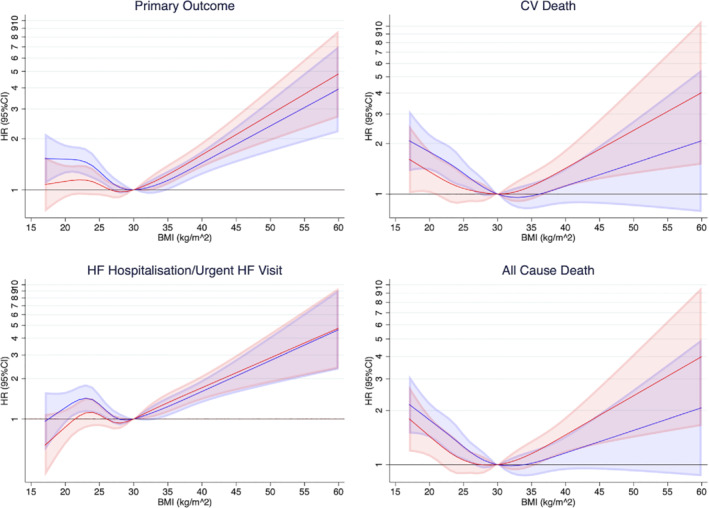
Figure 1.

Risk of outcomes according to body mass index (BMI). These restricted cubic splines demonstrate the risk of each outcome modelling BMI as a continuous variable. The baseline spline in blue is adjusted for history of heart failure (HF) hospitalization (apart from for all‐cause death), randomized treatment and stratified by diabetes status. The red spline has additional adjustment for age, sex, race, region, systolic blood pressure, estimated glomerular filtration rate, heart rate, hypertension, atrial fibrillation, ischaemic aetiology, left ventricular ejection fraction, New York Heart Association class, myocardial infarction, coronary artery bypass graft, stroke, and N‐terminal pro‐B‐type natriuretic peptide. The reference point is BMI 30 kg/m2. The shaded areas represent 95% confidence intervals (CI). The lowest risk of the primary outcome is around 30 kg/m2. There is evidence of a U‐shaped relationship seen with higher risk with both low and very high BMI. A similar pattern is seen for the other outcomes of interest. The adjusted models show the excess risk in the lowest BMI category is attenuated while the risk in the highest BMI categories is accentuated. CV, cardiovascular; HR, hazard ratio.
