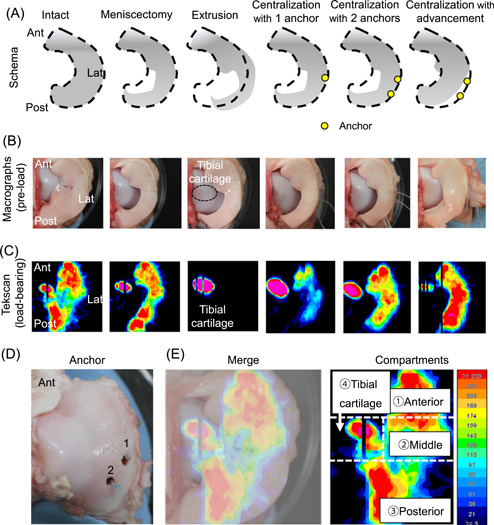
Figure 2.

Load distribution analyzed with a pressure mapping sensor system. (A) Schema of the experiments from an overhead view. (B) Pre‐load macrographs of the meniscus from the overhead view. (C) Representative load distribution at an axial compressive force of 200 N. (D) Macrograph of first and second anchor placements on the tibia. (E) Tibial cartilage with lateral meniscus; superposed image of the load distribution and a macro picture, with the lateral tibial surface divided into four compartments [Color figure can be viewed at wileyonlinelibrary.com]
