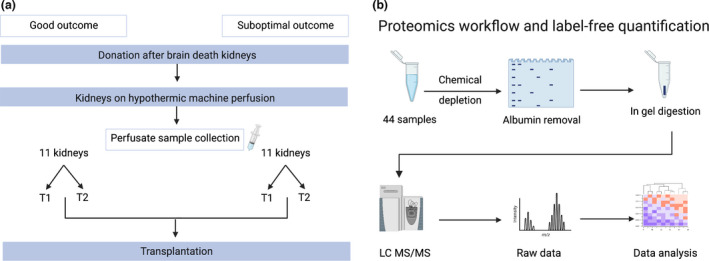
Figure 1.

Experimental design and workflow. (a) Overview of kidney perfusate sample collection. Perfusate samples were selected on the basis of 1‐year transplant outcomes. Good outcome (GO) was defined as kidney function with an estimated glomerular filtration rate (eGFR) ≥ 45 ml/min/1.73 m2 and a serum creatinine level of ≤ 120 µmol/l, whereas suboptimal outcome (SO) was defined as kidneys with an eGFR ≤ 45 ml/min/1.73 m2 and a serum creatinine level of ≥ 120 µmol/l. Samples from each kidney were taken at 2 time points: 15 min after the start of HMP (T1) and at the end of HMP (T2). (b) Workflow for proteomics analysis. A total of 44 samples were analysed (11 kidneys per group, 22 samples per outcome). Perfusate samples were chemically depleted and loaded onto a gel for SDS‐PAGE. Albumin bands were removed, and samples were prepared for in‐gel digestion, desalted and analysed using LC‐MS/MS. Raw peaks and spectra were searched against Homo sapiens database and data were analysed. eGFR, estimated glomerular filtration rate; LC‐MS/MS, liquid chromatography–tandem mass spectrometry. (Image created using biorender.com).
