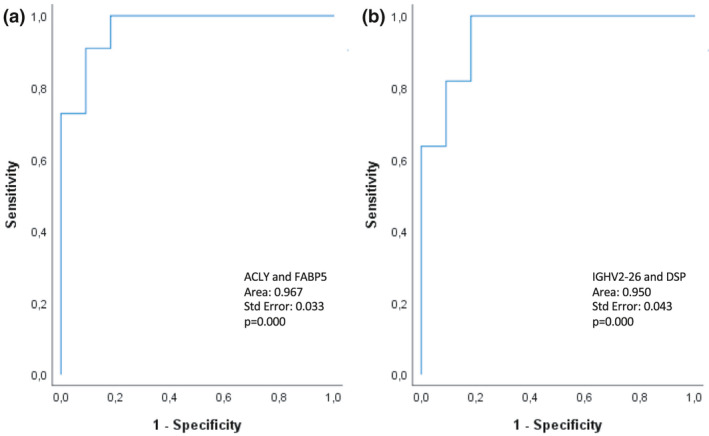
Figure 4.

Receiver‐operated (ROC) curves for the prediction models based on T1 and T2. (a) Perfusate analysis at T1 shows a 91% predictive value for ATP‐citrate synthase (ALCY) and fatty acid‐binding protein 5 (FABP5). (b) Perfusate analysis at T2 shows an 86% predictive value for immunoglobulin heavy variable 2‐26 (IGHV2‐26) and desmoplakin (DSP).
