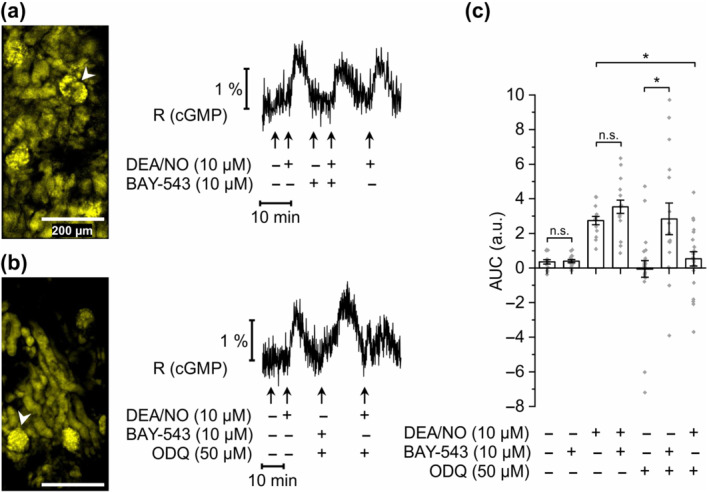
FIGURE 2.

sGC activator‐induced cGMP generation in glomeruli of ODQ‐treated kidney slices. FRET‐based cGMP imaging was performed in glomeruli of kidney slices from R26‐CAG‐cGi500(L1) mice. (a) Representative measurement of a glomerulus without ODQ application. During the recording, diethylamine NONOate (DEA/NO; 10 μM), BAY‐543 (10 μM), or a combination of both substances was applied to the slices for 2 min. Black trace represents the cyan fluorescent protein/yellow fluorescent protein (CFP/YFP) ratio R, which indicates cGMP concentration changes. White arrowhead points towards the glomerulus represented in the measurement shown to the right. (b) Representative measurement of a glomerulus with ODQ application. DEA/NO (10 μM), BAY‐543 (10 μM), or a combination of both substances was applied with or without 5 min pretreatment with ODQ (50 μM). (c) Statistical analysis was performed with the AUC of the signals. Note that negative AUC values in the presence of ODQ might be due to reduced endogenous cGMP generation compared with baseline conditions. Data represent mean ± SEM (n = 14, 16, 14, 16, 24, 16 and 21 from left to right). Scale bars, 200 μm. *P < .05; n.s., not significant
