
FIGURE 3.
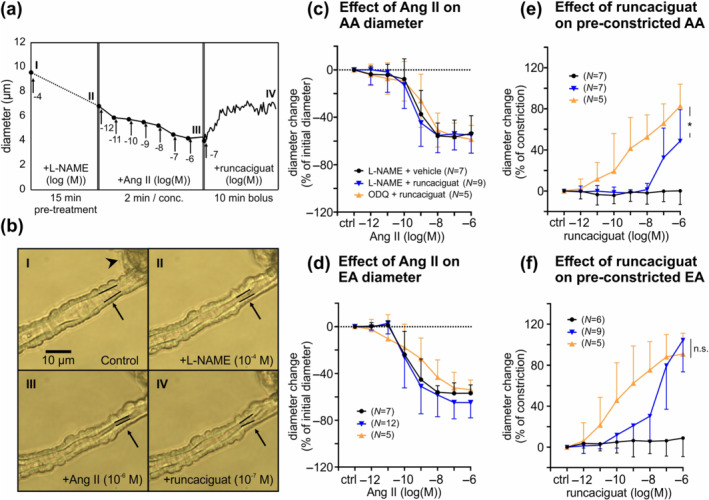
Runcaciguat‐induced dilation of angiotensin II (Ang II) pre‐constricted glomerular arterioles pretreated with L‐NAME or ODQ. Diameter changes of afferent (AA) and efferent arterioles (EA) upon application of various substances were monitored. (a) Representative sequence of an afferent arteriole diameter measurement: Endogenous NO generation was inhibited with L‐NAME (10−4 M) and then the afferent arteriole was pre‐constricted with incremental concentrations of Ang II (10−12 to 10−6 M). The diameter change of the pre‐constricted afferent arteriole in response to runcaciguat (10−7 M, bolus application) was followed. (b) Images illustrate the monitored vessel during each step of the sequence as indicated by roman numbers. Black arrows point towards the segment subjected to quantitative evaluation. The inner vessel wall in this segment is highlighted with black lines. Black arrowhead points towards the attached glomerulus. (c, d) Resting afferent and efferent arterioles were pretreated with L‐NAME (‘L‐NAME + vehicle’ and ‘L‐NAME + runcaciguat’ groups) or ODQ (10−5 M; ‘ODQ + runcaciguat’ group) and then pre‐constricted with incremental concentrations of Ang II in presence of L‐NAME or ODQ. Values are given as percent change of the initial diameter after L‐NAME or ODQ pretreatment and before Ang II application. (e, f) Pre‐constricted afferent and efferent arterioles were treated with cumulative concentrations of runcaciguat or vehicle (DMSO). Values are given as percent of the maximal constriction induced by Ang II. Data represent mean ± SD. In panels (c)–(f), n values are indicated in parentheses. The colour code given in panels (d)–(f) corresponds to the experimental groups indicated in panel (c). scale bar, 10 μm. *P < 0.05