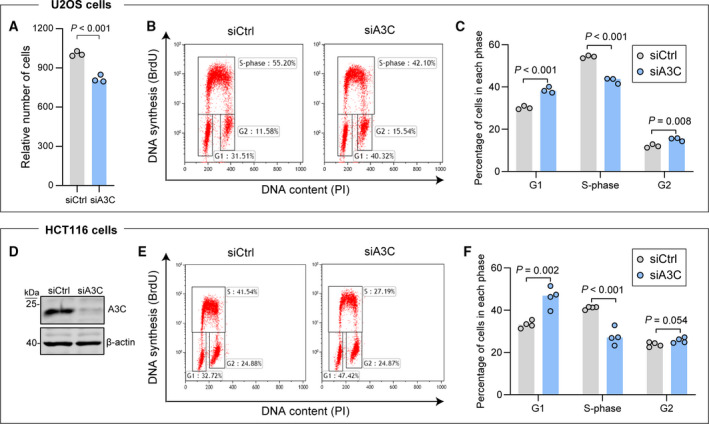
Fig. 7.

A3C depletion reduces cell proliferation. (A) U2OS cells were transfected with either control siRNA (siCtrl) or siRNAs targeting A3C (siA3C) for 48 h. The cells were then trypsinized and plated at a density of 4∙104 cells·well−1 (12‐well plates). Seventy‐two hours later, the relative cell number was quantitated using a Presto‐Blue assay. (B) Representative cell cycle profiles of control and A3C knockdown cells. (C) Quantitation of cell cycle distribution in control and A3C‐depleted U2OS cells. (D) Western blot depicting the efficiency of A3C knockdown in HCT116 cells. (E, F) FACS analysis of cell cycle profiles in control and A3C knockdown HCT116 cells (representative profiles in panel E, and quantitation in panel F). Statistical analysis: panels C and F, two tailed unpaired t tests (P values corrected for multiple comparisons with the Benjamini–Hochberg method).
