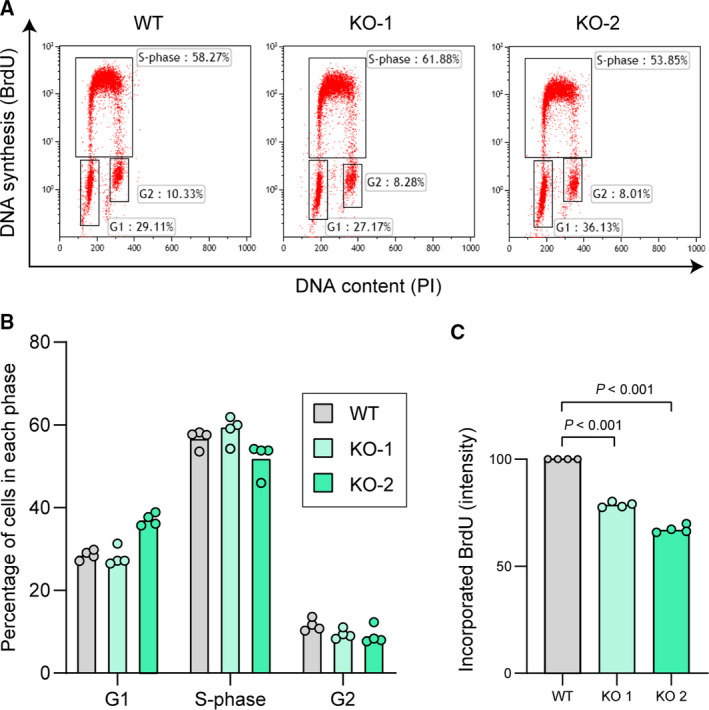
Fig. 8.

Effect of permanent A3C loss on cell proliferation. (A‐B) Representative cell cycle profiles (panel A) and the corresponding cell cycle distribution quantitation (panel B) of wild‐type U2OS cells (WT) and two A3C knockout (KO) U2OS cell lines. (C) DNA synthesis rate (amount of BrdU incorporated in a 25‐min pulse) in the cells shown in panels A–B. Graphs indicate the median and the individual experimental values normalized to the wild‐type cells. Statistical analysis: unpaired Student’s t tests.
