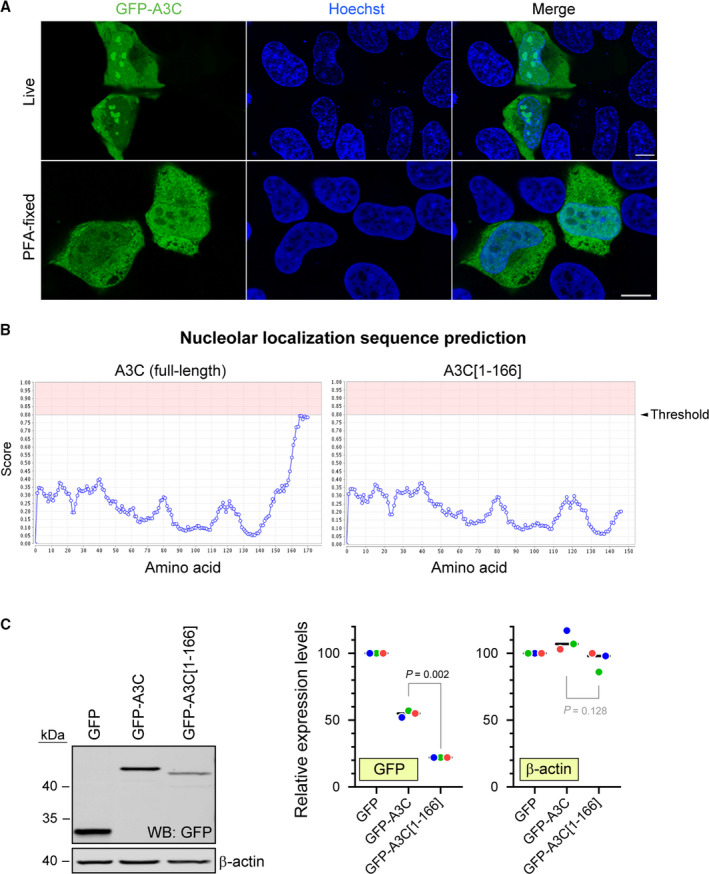
Fig. 9.

Effect of cell fixation on A3C subcellular location and role of the nucleolar localization sequence of A3C on its expression. (A) Top row: U2OS cells were transfected with GFP‐APOBEC3C and 24 h later were analyzed using a confocal microscope. Bottom row: cells were transfected as above and 24 h later the cells were fixed in PFA, permeabilized, and stained with an anti‐GFP antibody. Nuclei were counterstained with Hoechst 33342. (B) Nucleolar localization sequence prediction in full‐length A3C (left) and A3C[1‐166] (right). (C) Western blot depicting the expression levels of GFP constructs in U2OS cells transfected for 24 h with the plasmids encoding the indicated constructs. The quantitation shown on the right is normalized to the ‘GFP’ values. Data points with the same color are derived from the same independent experiment. The black horizontal bars correspond to the median. The P‐values were obtained through paired t tests. Shaded P values are those > 0.05.
