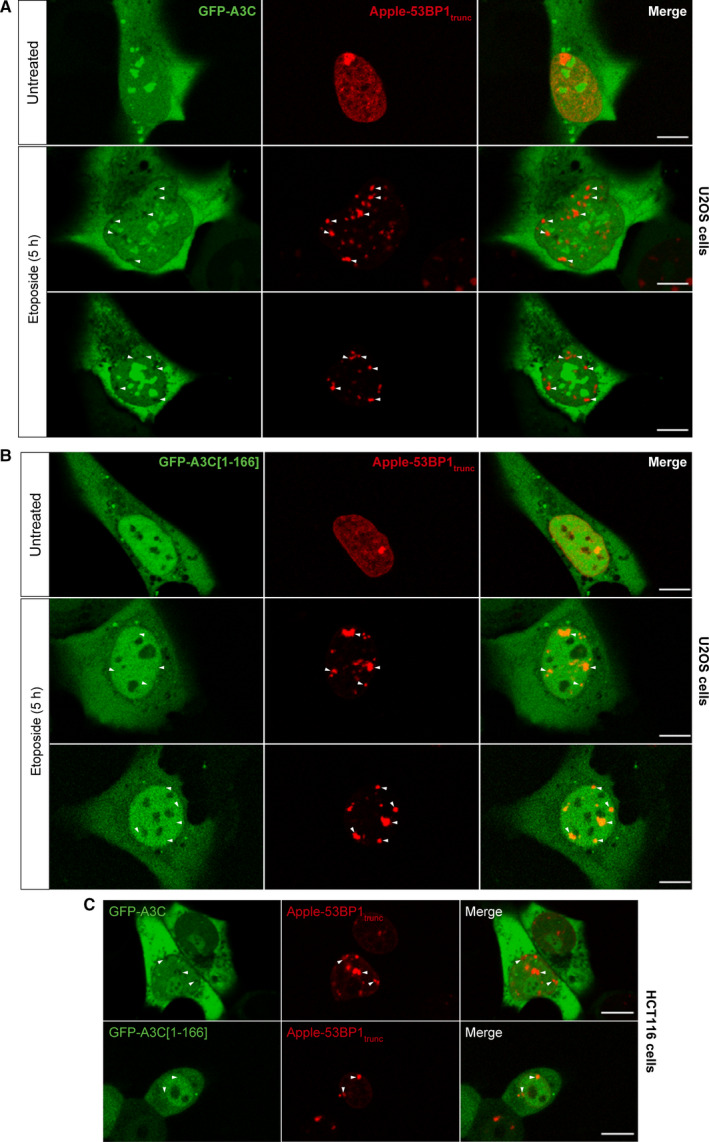
Fig. 11.

A3C is excluded from DNA damage sites. (A) Confocal images of live U2OS cells co‐transfected with mApple‐h53BP1[1220‐1709].lti and GFP‐hAPOBEC3C‐V5. Twenty‐four hours post‐transfection, the cells were left either untreated (top rows) or treated with 1 µm etoposide for 5 h (second and third rows). White arrowheads indicate 53BP1 foci formation upon accumulation at DNA double‐strand breaks. (B) Same procedure as in panel A, except that the cells were transfected with GFP‐hAPOBEC3C[1‐166]‐V5. Scale bars, 10 µm. (C) As panels A and B but using HCT116 cells instead of U2OS cells. The micrographs represent live cells analyzed by confocal microscopy. Scale bars: 10 µm.
