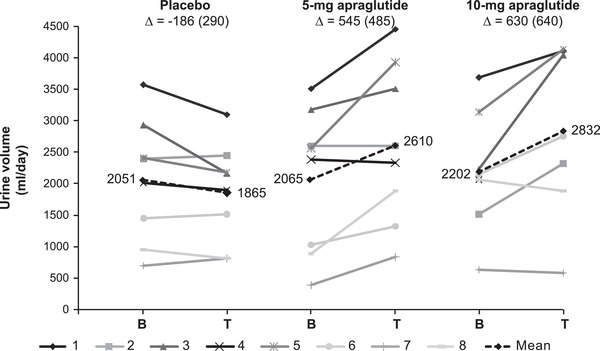
FIGURE 2.

Individual and mean changes from baseline to the end of treatment in urine volume output. The dashed line represents the mean, and ∆ represents the mean change from baseline (SD). One patient discontinued after the first dose of 10 mg (data excluded graphically). The difference in grayscale shows the individual patients. B, baseline; T, treatment
