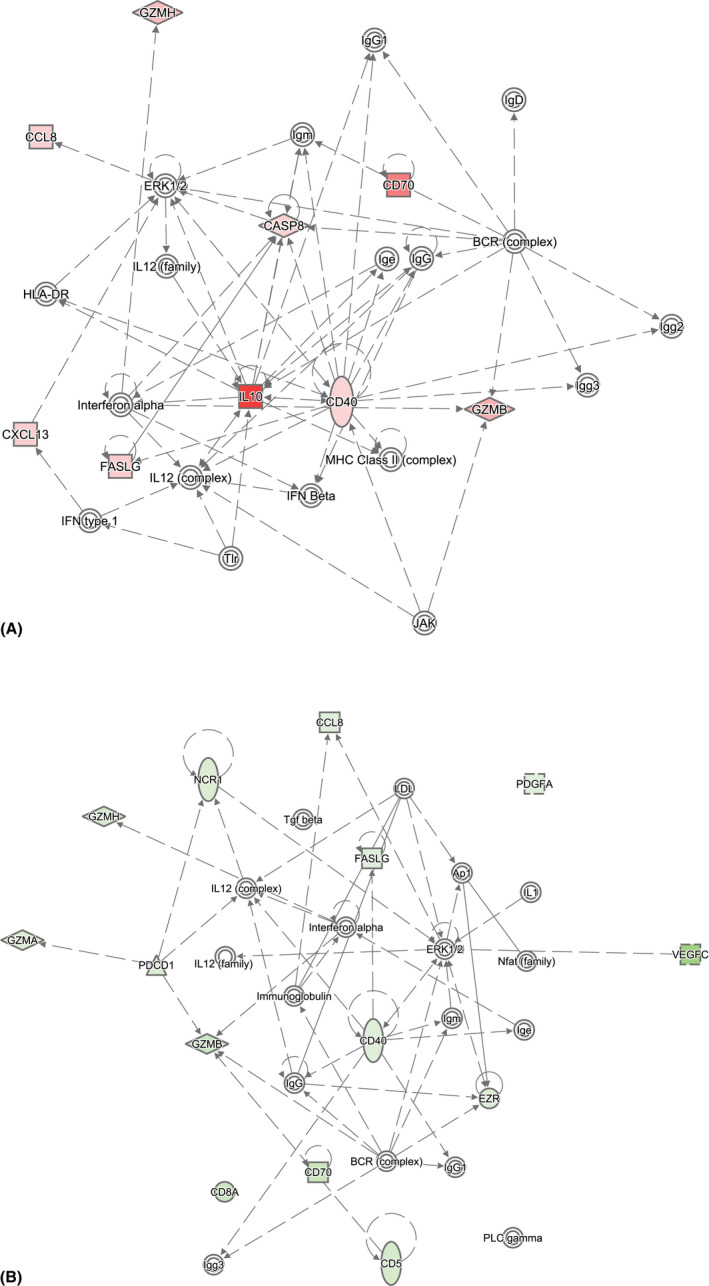
Fig. 2.

Network analysis based on differentially expressed vitreous proteins comparing (A) (P)VRL versus all other aetiologies and (B) granulomatous versus all other aetiologies. Differentially upregulated proteins are depicted in red, while downregulated proteins are depicted in green. A solid line represents a direct protein–protein interaction, while a dotted line indicates an indirect relationship. Networks were filtered to only include human experimentally observed data.
