
FIGURE 2.
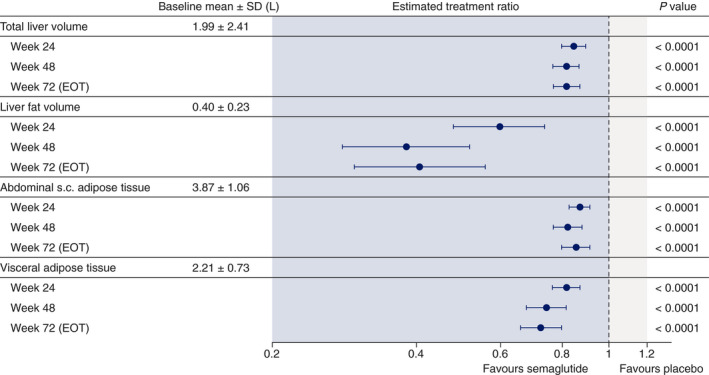
Changes from baseline (estimated treatment ratios and 95% confidence intervals) in total liver volume, liver fat volume, abdominal subcutaneous (s.c.) adipose tissue and visceral adipose tissue assessed by magnetic resonance imaging at weeks 24, 48 and 72 with semaglutide 0.4 mg once daily and placebo. Data from on‐treatment period. Estimates are from mixed model for repeated measures. EOT, end of treatment; SD, standard deviation