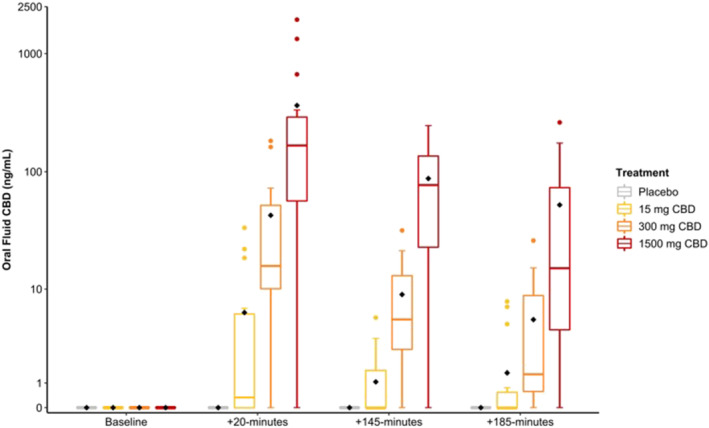
FIGURE 1.

Oral fluid cannabidiol (CBD) concentrations at baseline and ~20‐, ~145‐ and ~185‐min posttreatment. Grey: placebo; yellow: 15‐mg CBD; orange: 300‐mg CBD; and red: 1500‐mg CBD. The black diamond represents the mean value [Colour figure can be viewed at wileyonlinelibrary.com]
