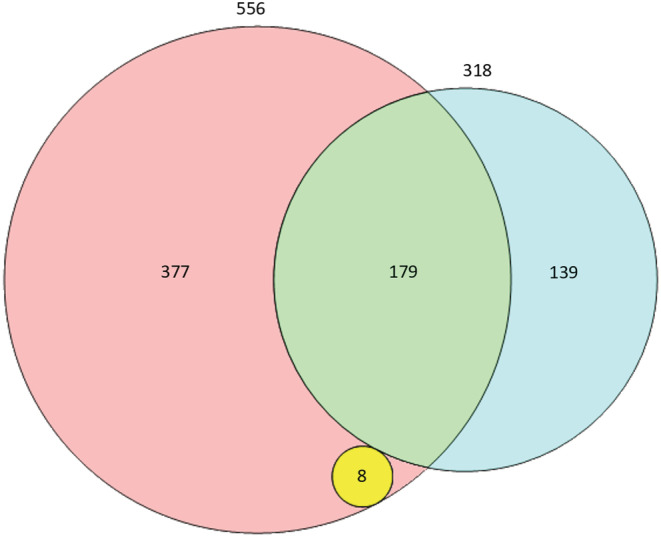
FIGURE 3.

Venn diagram presenting unique adverse drug reactions (ADRs). The blue circle (n = 318), including the green portion, represents the total number of unique ADRs identified by the manual electronic health record (EHR) review. The red circle (n = 556) including the green and yellow portions represents the total number of unique ADRs identified by the rule‐based EHR review (true positives + false positives). The red section (n = 377) represents the false positives. The green section (n = 179) represents the number of true positives. The yellow circle represents ADRs found only by the rule‐based EHR review
