Figure 1.

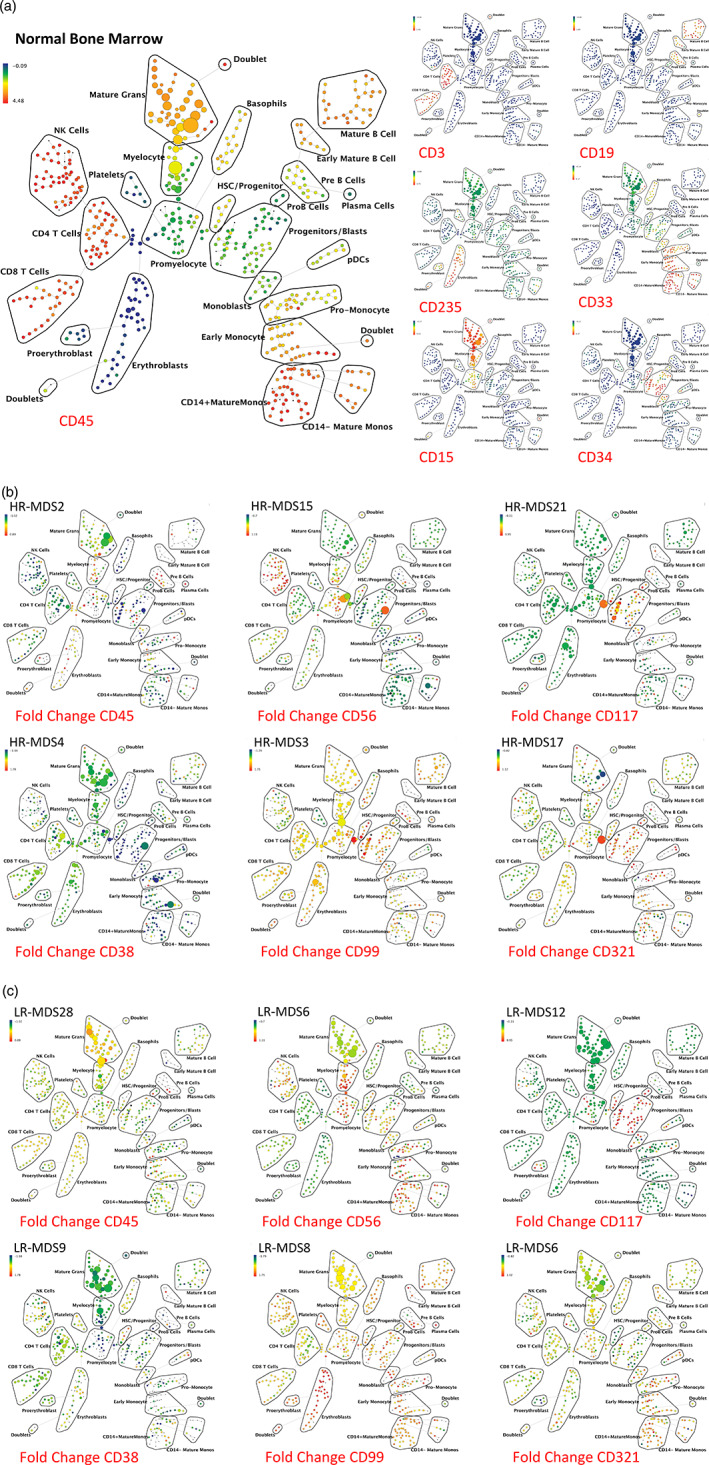
SPADE analysis enables detection of aberrant surface marker expression patterns. (a) SPADE plots of normal bone marrow sample #6. SPADE clustering was performed on all samples (normal and MDS) simultaneously to generate a single tree structure for all samples. All of the cell events from each sample were then mapped to the common tree structure. Each cell cluster (node) of the SPADE tree in (a) is colored for the median expression of the indicated markers from low (blue) to high (red). (b) SPADE tree colored for the fold change in each cell node for each of the indicated markers relative to the average of the eight healthy donor samples for the same node. Cell nodes in (b) are colored from lowest expression relative to normal (blue) to highest expression relative to normal (red); yellow and light green colors indicate no change in expression relative the average of the control samples. These can be compared to the normal samples shown in Figure S4. HR indicates higher‐risk MDS (IPSS of Int‐2 or High) LR indicates lower‐risk MDS (IPSS of low or Int‐1). The eight replicate control samples came from five healthy donors. The size of each node is correlated to the fraction of cells mapping to the node; however, a minimum size was enforced for most nodes to allow visualization of node color. Immunophenotypic grouping of nodes was performed manually on the basis of the median marker expression level of each node, and based on analysis of the relevant biaxial plots (e.g., CD38 vs. CD34) [Color figure can be viewed at wileyonlinelibrary.com]
