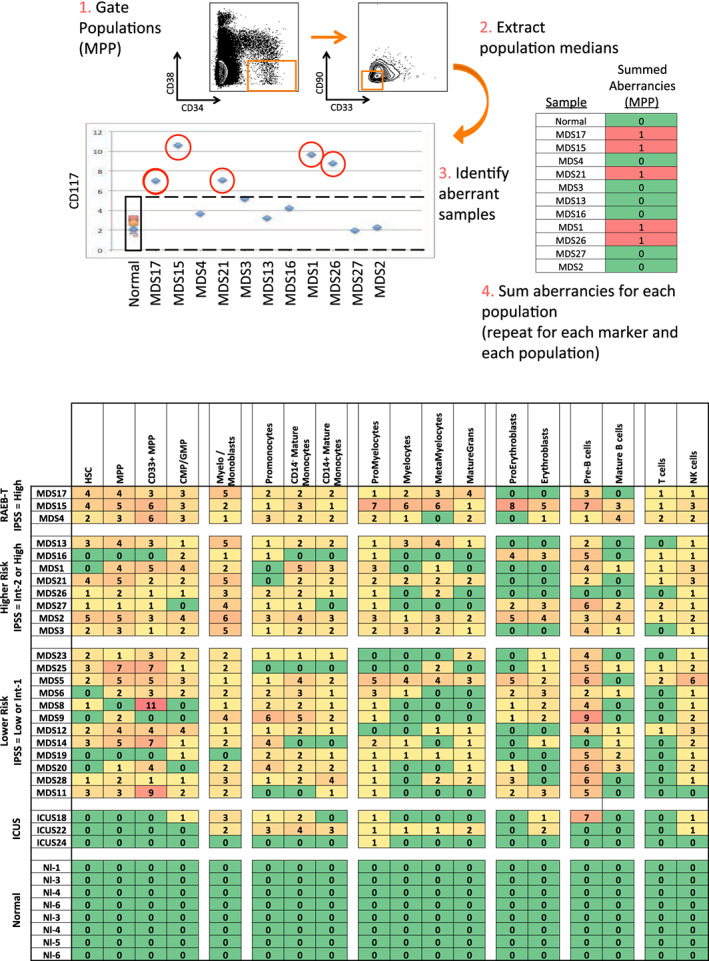
Figure 2.

Systematic detection of multiple small aberrancies defines large immunophenotypic changes across hematopoiesis in patients with MDS. (a) Method for defining aberrant marker expression. All immunophenotypic gates were defined on the basis of the normal samples and the same gates were applied to the each of the MDS samples. Once each population was gated, the median expression of each of the 31 surface markers was extracted and compared to the median expression in the eight samples from five healthy donors for each gated population. MDS samples that were outside twofold the total variance of the normal samples were considered to be aberrant for that marker (CD117 is shown as an example). (b) The total number of aberrant markers (of 31 measured markers) was summed for each population and each patient. Each box is colored for the number of the 31 markers that was aberrant for each patient (rows) in each gated immunophenotypic population (columns). The color scale ranges from green indicating no aberrant marker expression to the highest numbers of aberrancies colored red. The exact number of aberrant markers expressed (of the 31 tested) is printed in each box. The high rates of aberrancy observed in the pre‐B cell population may be due in part to contamination of this gate with dimly CD19‐positive malignant myeloid cells due to the limited number of markers defining this immunophenotypic subset (CD19 and CD10) and to the relatively dim staining of these antibodies in normal cells. Because the normal reference range used for this analysis was larger than the absolute variance of the healthy donor samples; no aberrancies were observed in the healthy donor control samples by definition. Note that samples MDS3, MDS13, and MDS21 come from serial biopsies of the same patient (each several months apart) and demonstrate consistent properties [Color figure can be viewed at wileyonlinelibrary.com]
