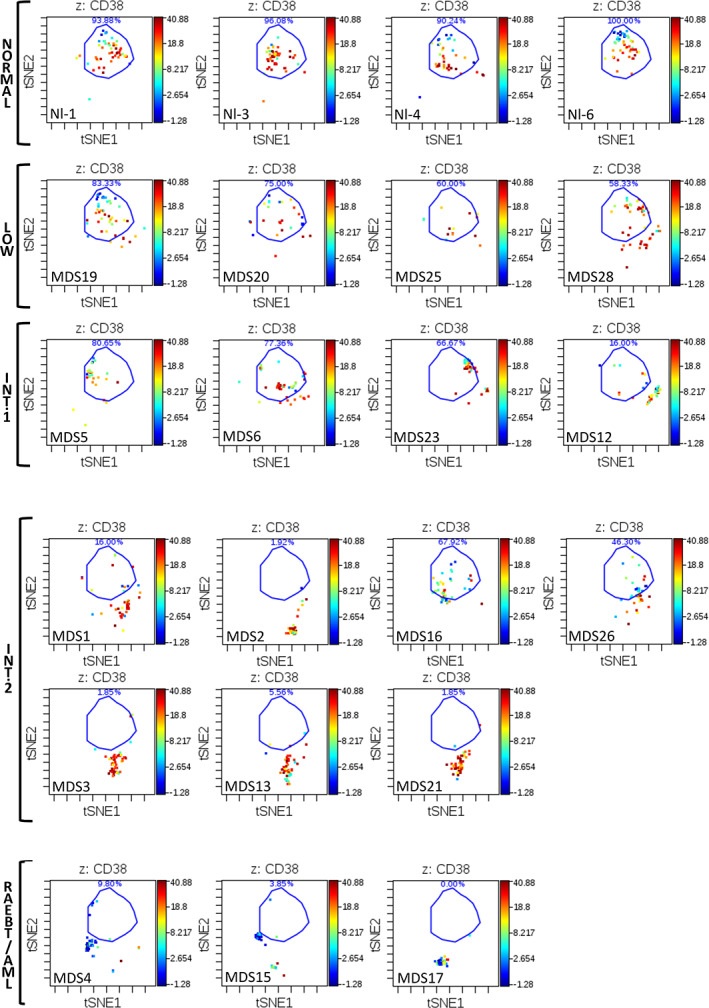
Figure 3.

viSNE analysis of CD34 + CD38low subset reveals distinct immunophenotypic patterns in high‐dimensional space. Each sample was analyzed by viSNE (up to 5,000 sampled events per individual) using 19 dimensions (Table S1). A gate (light blue line) encompassing the vast majority of normal CD34 + CD38low events is shown for reference. The MDS subtype and sample is indicated for each viSNE map. Each cell event is colored for its expression level of CD38 from blue (0 ion counts) to red (approximately 40 ion counts). Red cell events still fall within the CD34+CD38low gate and demonstrated dim CD38 expression. Note that samples MDS3, MDS13, and MDS21 come from serial biopsies of the same patient (each several months apart) and demonstrate consistent properties
