Figure 6.

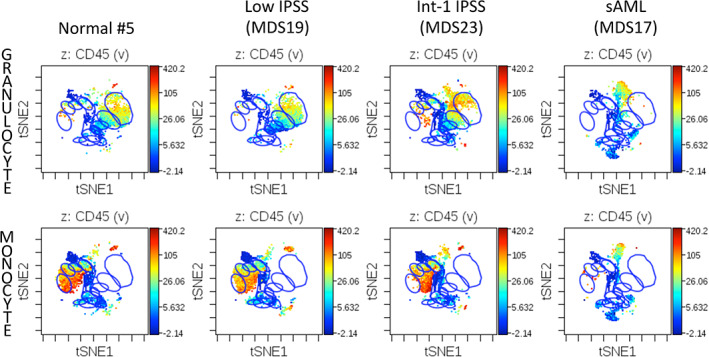
Developmental progression in control and MDS samples during granulocyte and monocyte differentiation. Blue gates on the viSNE projection show the positions of the normal immunophenotypic developmental stages as described in Figure S10

Developmental progression in control and MDS samples during granulocyte and monocyte differentiation. Blue gates on the viSNE projection show the positions of the normal immunophenotypic developmental stages as described in Figure S10