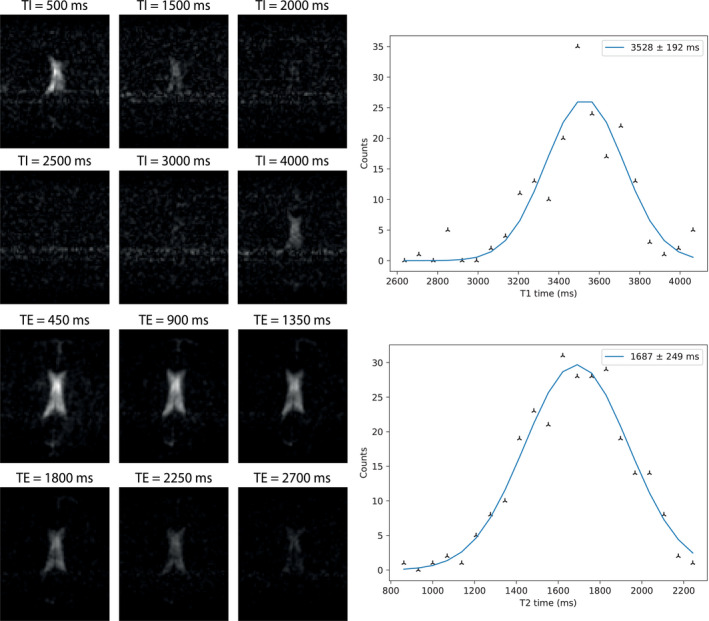
FIGURE 3.

(Top left) Images acquired using an inversion recovery sequence with 6 different inversion times for CSF measurement: the background signal from WM/GM is suppressed by using a very long effective TE. (Top right) A plot of binned T1 times with a single Gaussian curve fitted through the data. (Bottom left) Images acquired using a TSE sequence, with 6 different TEs with (bottom right) a corresponding Gaussian fit
