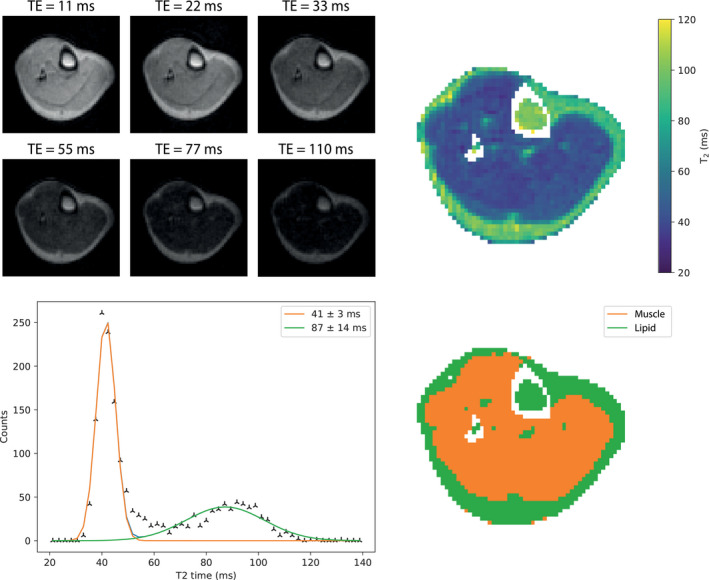
FIGURE 5.

(Top left) Subset of images acquired with different TEs using a TSE readout. (Top right) A T2 map reconstructed from the images; images were acquired with 10 different TEs. (Bottom left) A histogram of the T2 map with 2 Gaussian functions fitted. (Bottom right) A segmented map of the images with the colors (orange: muscle; green: lipid) corresponding to the area under the fitted curves of the same color
