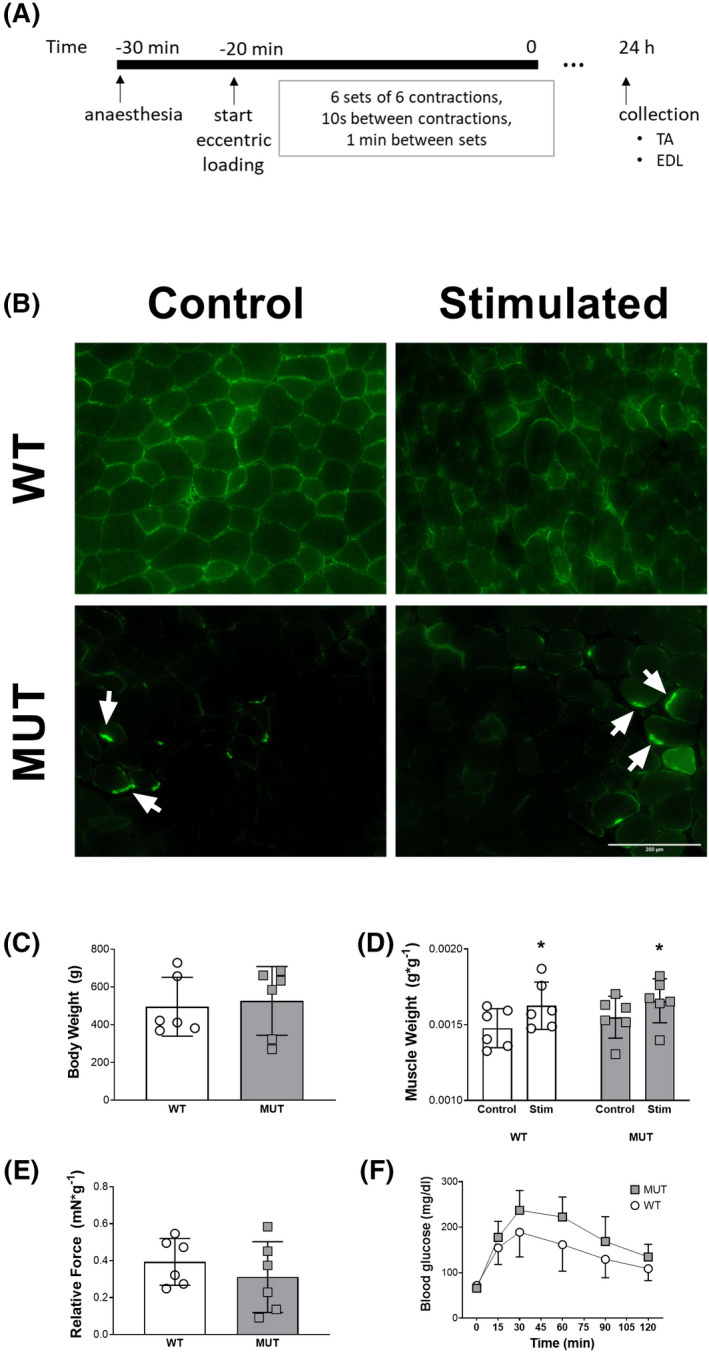
FIGURE 1.

The animal model and the effect of electrostimulation. A, Eccentric stimulation and collection protocol. B, Immunohistological desmin staining of tibialis anterior sections. C, Body weight of the animals. D, Tibialis anterior mass in the contralateral control‐ and the stimulated leg of WT and MUT animals. E, Force during plantar flexion relative to the body weight of the animals. F, Intraperitoneal glucose tolerance test in WT and MUT animals. *denotes a statistically significant difference (Figure 1D, stimulation: P < .05)
