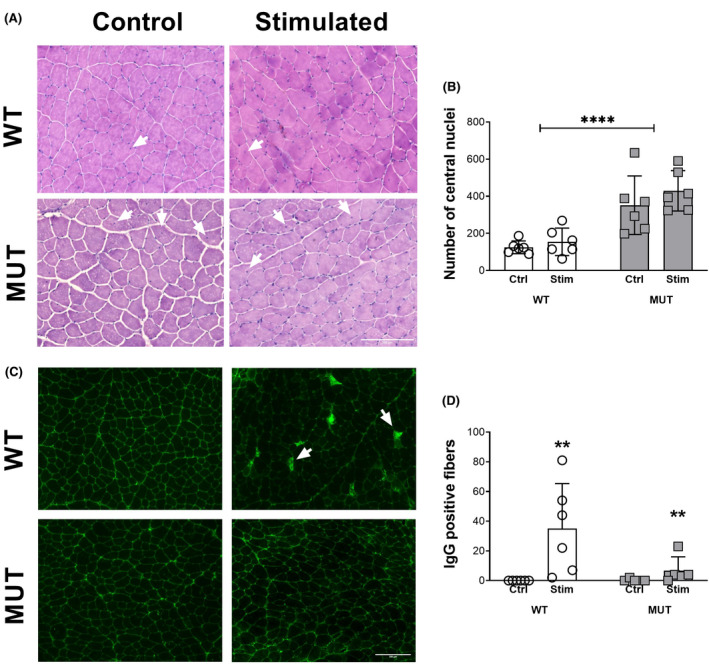
FIGURE 2.

Histological analysis of acute and chronic injury. A, Hematoxylin and eosin staining in tibialis anterior sections of WT and MUT rats. White arrows denote examples of central nuclei. B, Quantification of the number of central nuclei across the entire section. C, IgG staining in tibialis anterior sections of WT and MUT rats. White arrows denote examples of IgG positive fibers. D, Quantification of IgG positive fibers across the entire section. ** and **** denote statistically significant differences (Figure 2B, genotype: P < .0001), (Figure 2D, stimulation: P < .01)
