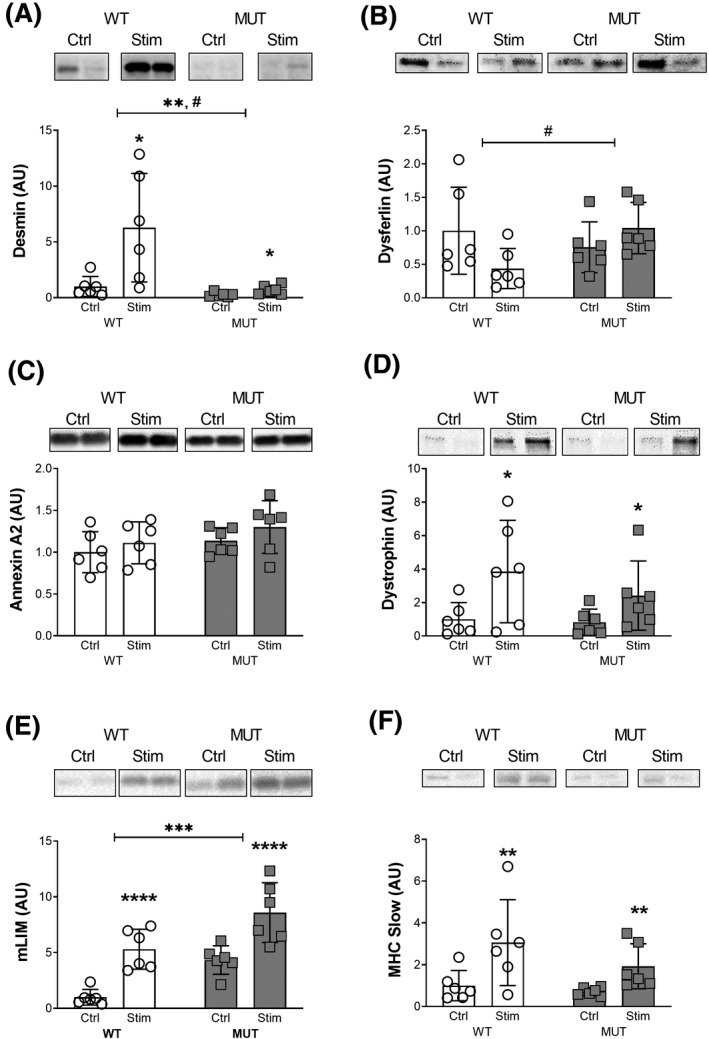
FIGURE 4.

Force transfer and membrane injury. Western Blot analysis of protein levels: A, Desmin. B, Dysferlin. C, Annexin A2. D, Dystrophin. E, Muscle LIM Protein/Cysteine and Glycine‐rich Protein 3 (mLIM). F, Myosin Heavy Chain (MHC) Slow. #, *, **, *** and **** denote statistically significant differences (Figure 4A, stimulation: P < .05, genotype: P < .01, interaction: P < .05), (Figure 4B, interaction: P < .05), (Figure 4D, stimulation: P < .05), (Figure 4E, stimulation: P < .0001, genotype: P < .001), (Figure 4F, stimulation: P < .01). Protein levels were normalized to total protein content, bands display representative biological duplicates of each condition. For each protein, all samples were run together on the same gel
