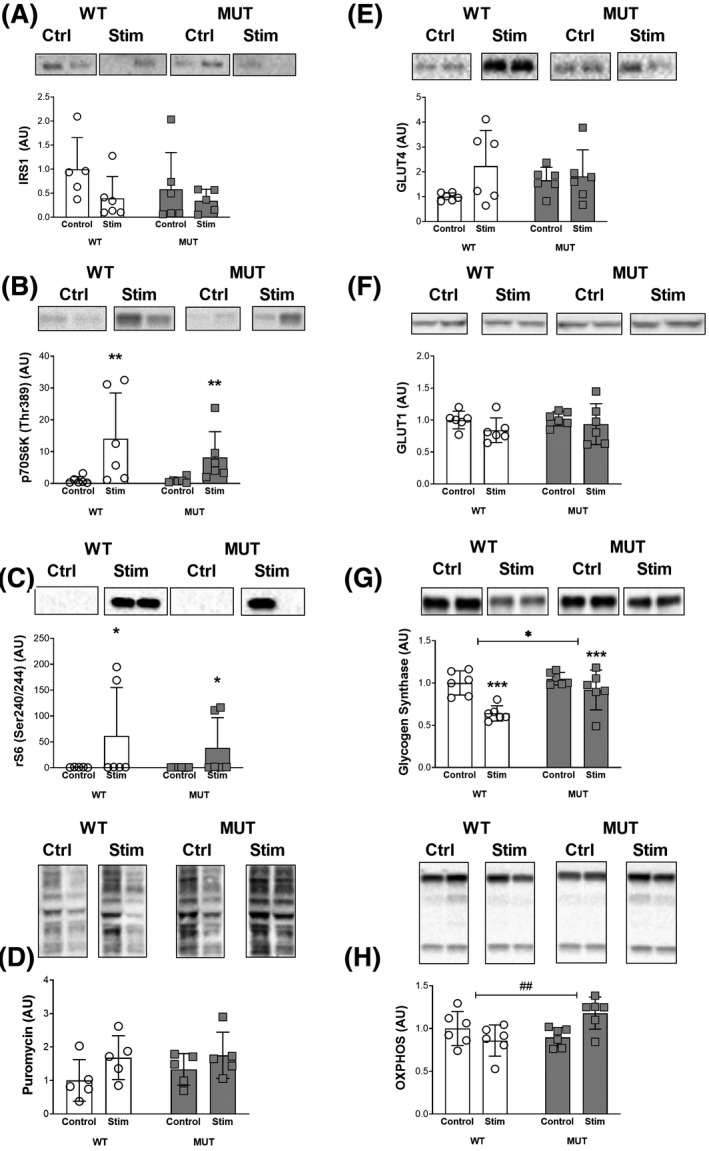
FIGURE 5.

Skeletal muscle metabolism and remodeling. Western blot analysis of protein levels: A, Total insulin receptor substrate 1 (IRS1). B, Phospho‐p70 ribosomal S6 kinase 1 (p70S6K) (Thr389). C, Phospho‐ribosomal protein S6 (rp S6) (Ser240/244). D, Puromycin. E, Glucose transporter type 4 (GLUT4). F, Glucose transporter type 1 (GLUT1). G, Glycogen synthase. H, Total oxidative phosphorylation (OXPHOS). ##, *, ** and *** denote statistically significant differences (Figure 5B, stimulation: P < .01), (Figure 5C, stimulation: P < .05), (Figure 5G, stimulation: P < .001, genotype: P < .05), (Figure 4H, interaction: P < .01). Protein levels were normalized to total protein content, bands display representative biological duplicates of each condition. For each protein, all samples were run together on the same gel
