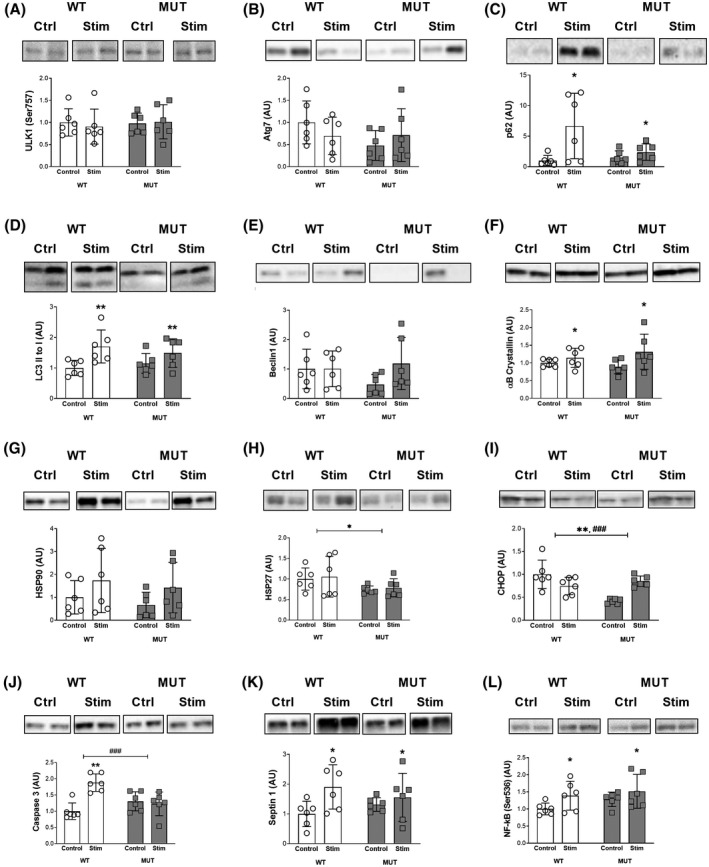
FIGURE 6.

Cell damage, degradation, and apoptosis. Western blot analysis of protein levels: A, Phospho‐Unc‐51 like autophagy activating kinase 1 (ULK1) (Ser757). B, Autophagy related 7 (Atg 7). C, Sequestosome 1 (p62). D, Microtubule‐associated proteins 1A/1B light chain 3B (LC3B). E, Beclin1. F, αB crystallin. G, Heat shock protein‐alpha (HSP90). H, Heat shock protein β‐1 (HSP27). I, C/EBP‐homologous protein (CHOP). J, Caspase 3. K, Septin 1. L, Nuclear factor κB (NF‐kB) (Ser536). ###, *, ** and *** denote statistically significant differences (Figure 6C, stimulation: P < .05), (Figure 6D, stimulation: P < .01), (Figure 6F, stimulation: P < .05), (Figure 6H, genotype: P < .05), (Figure 6I, genotype: P < .01, interaction: 0.001), (Figure 6J, stimulation: P < .01, interaction: P < .001), (Figure 6K, stimulation: P < .05), (Figure 6L, stimulation: P < .05). Protein levels were normalized to total protein content, bands display representative biological duplicates of each condition. For each protein, all samples were run together on the same gel
