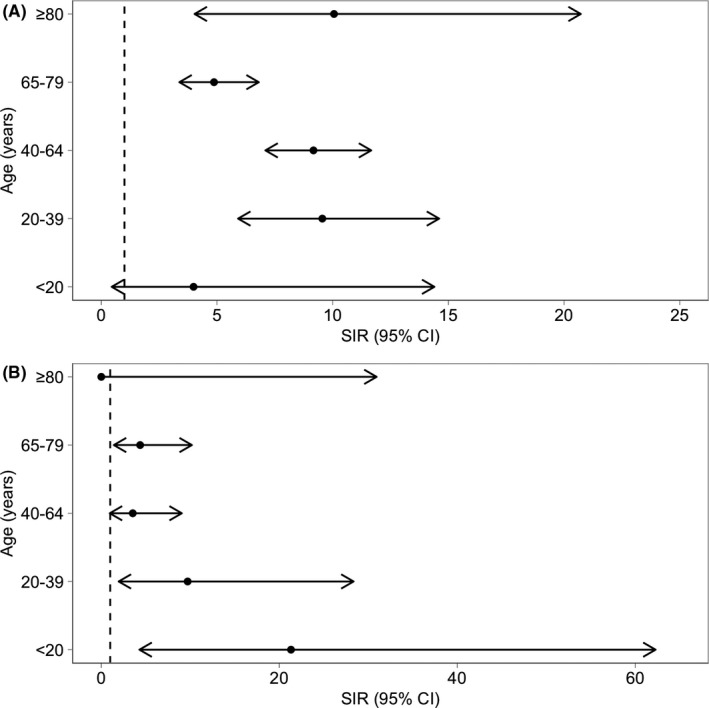
FIGURE 2.

Standardized incidence rates of Campylobacter and Salmonella infections in SOT recipients. Forest plot representing standardized incidence rates and 95% confidence intervals of Campylobacter (A) and Salmonella (B) diagnosis in the Swiss Transplant Cohort Study compared to the Swiss general population from 2010 to 2018 according to age. Annual incidence of Campylobacter and Salmonella diagnosis per 100,000 patient‐years from 2010 to 2018 are available from the Swiss Federal Office of Public Health. CI, confidence interval; SIR, standardized incidence rate
