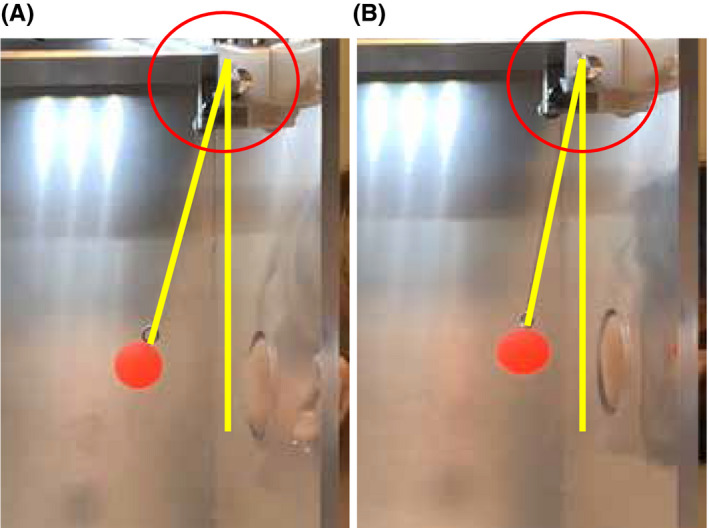
FIGURE 2.

Images for comparison of the elastic angle in two different age groups. (A) The elastic angle (angle in red circle) of the 20s group is significantly higher than that of the ≥50s group (B). Results were statistically compared using post hoc analysis with Bonferroni correction (P < .001)
