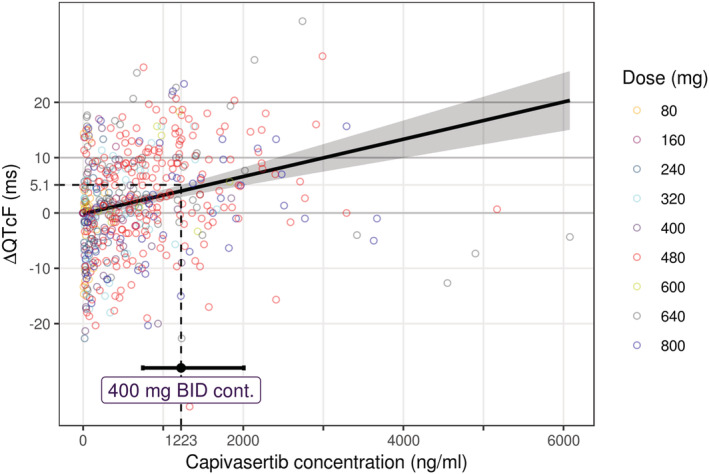
FIGURE 2.

Observed and model‐derived ΔQTcF vs plasma capivasertib concentration. Solid black line and gray area denote the mean and 90% CI of the model prediction; circles denote individual patient data with capivasertib dosage indicated by colour; dashed black line denotes the upper 90% CI limit of the model derived ΔQTcF at the geometric mean steady state C max measured with the expected therapeutic dose; error bars denote 95% CI for the geometric mean C max; BID, twice daily; C max, maximum plasma concentration; cont., continuous; QTcF, Fridericia‐corrected QT interval
