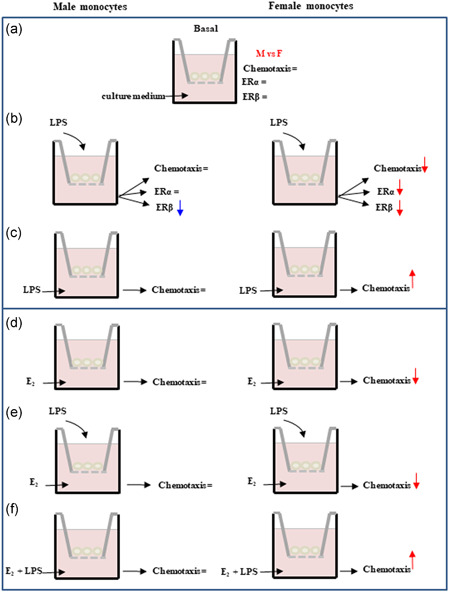
Figure 2.

Schematic representation of the different experimental conditions used for chemotaxis assay and a summary of observed sex differences. LPS, lipopolysaccharide; M, males; F, females. Rows represent an increase or a decrease. The simbol '=' indicate a lack of effect.
