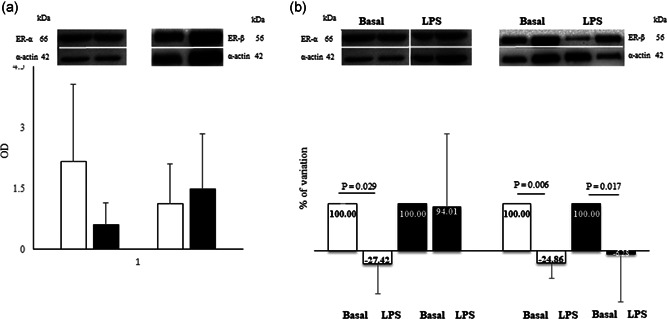
Figure 4.

(a) Western blot (up) and densitometric analysis (bottom) for ER‐α and ER‐β expression; (b) percentage of variation of ER‐α and ER‐β expression after 100 ng/ml LPS. The value of the percentages is indicated within the histograms. Data are expressed as the mean ± SD of at least five independent samples for each sex. Connectors represent the statistical difference. Black bars, male monocytes; white bars, female monocytes. The white dividing line between the bands has been used for the purpose of presentation as there is splicing between the basal and LPS lanes of ER‐α and α‐actin bands The bands relative to the basal expression are identical in panels (a) and (b) and have been adapted to the images for representative purposes
