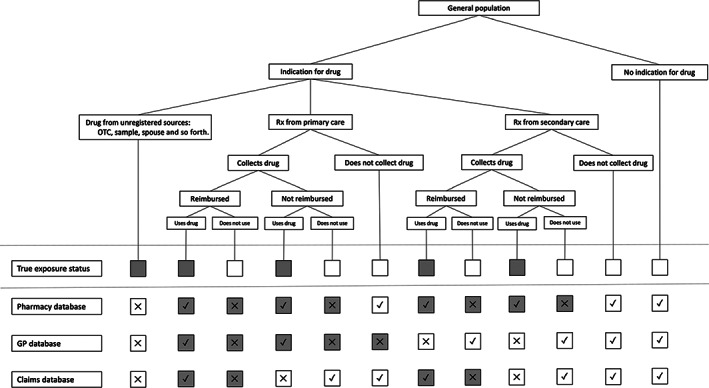
FIGURE 1.

Sources of exposure misclassification in pharmacoepidemiology and the effects in different types of databases. Gray squares indicate “exposed”; white squares indicate “unexposed”. Rx, prescription; X, misclassified; √, correctly classified

Sources of exposure misclassification in pharmacoepidemiology and the effects in different types of databases. Gray squares indicate “exposed”; white squares indicate “unexposed”. Rx, prescription; X, misclassified; √, correctly classified