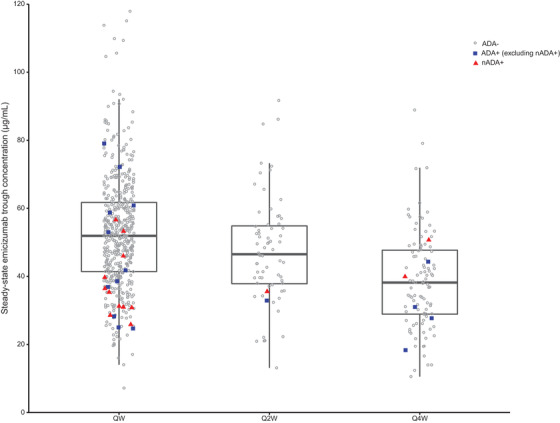
FIGURE 2.

Distribution of intra‐individual mean steady‐state trough plasma emicizumab concentrations by ADA status and dosing regimen, excluding participants with ADAs with decreased exposure (n = 4). Box plots represent 25th and 75th percentiles, bold lines within the box represent median values and whiskers represent 1.5 interquartile range for all concentration points regardless of the ADA status. ADA, anti‐drug antibody; nADA, neutralising ADA; Q2W, once every 2 weeks; Q4W, once every 4 weeks; QW, once weekly
